Other Reports
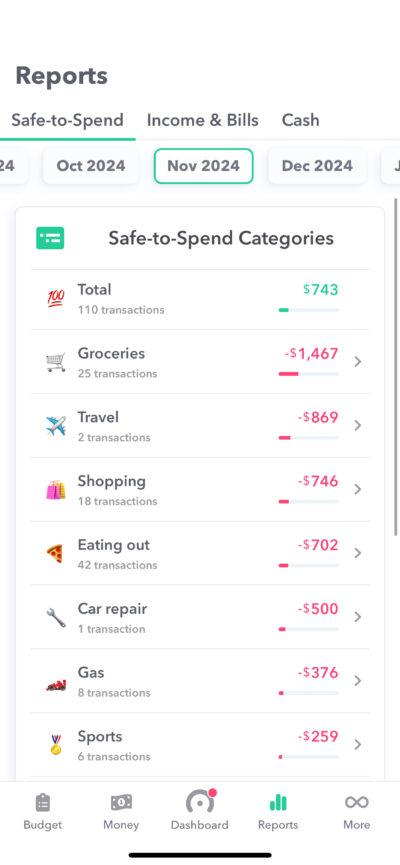
You can see how much you have spend in your Safe-to-Spend categories on a given month by accessing the monthly Safe-to-Spend report.
Where Do I Find My Monthly Reports
To find new monthly reports, tap “Reports” in your bottom navigation bar.
What Is In the Monthly Reports
Tapping on a month to show the spending in different categories for that month. You can also tap an individual category and see the transactions that are in that category along with a category trend report. If you want to edit any transactions, you can also tap any transaction to bring up the individual transaction and change the category from there if you’d like.
How Do I Switch Months
At the top of the screen you can switch months by tapping on the month you want to see. To see additional months in you can swipe left and right on the month bar.
Fund Report
You can see a history of transactions in your funds. The graph at the top of the screen will visualize the value of the transactions associated with the fund.
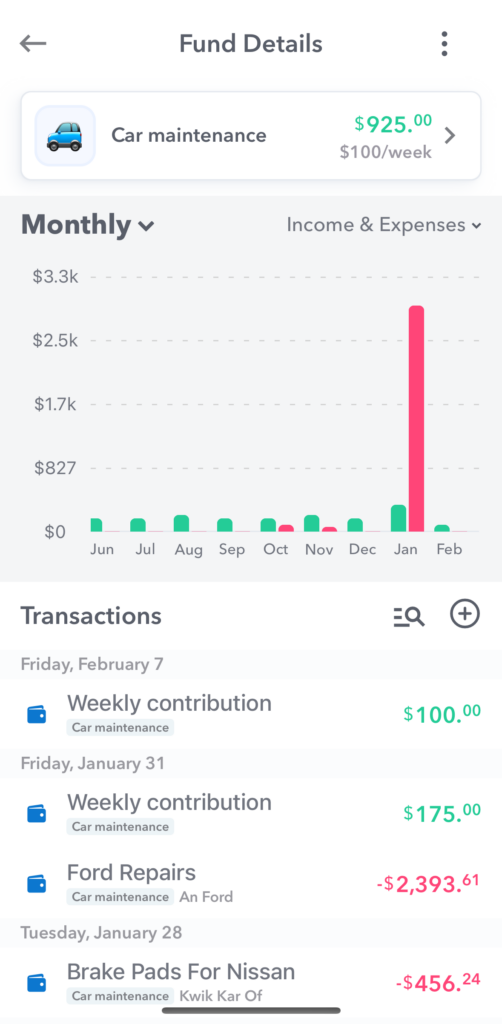
Toggle between “Monthly” and “Yearly” views by tapping on the top left of the graph.
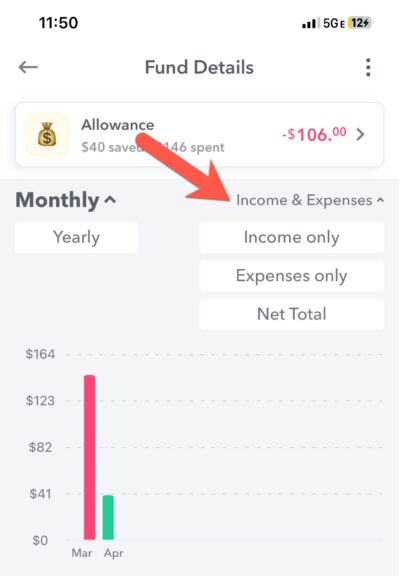
You can also filter what transactions you see by tapping the top right.
- Income & Expenses – Shows both income and expenses
- Income only – Shows only positive income items
- Expenses only – Shows only negative expense items
- Net Total – Subtracts the expenses from income first and shows the result.
Category Trend Reports
You can see how much you have spent in different Safe-to-Spend categories month-by-month.
To find see these trends first start by ongoing to your Monthly Safe-to-Spend report. Then tap on a category and this will bring up the Category Trend report.
So, if you wanted to see, for example, how much you spent on “Groceries” per month over the past year, tap on “Groceries” in the Monthly Safe-to-Spend report and it will bring up a screen with all your grocery spending.
At the top of the screen you will see a bar graph indicating the spending over time in the category you have chosen and down below you will see a list of all the transactions in that category.
By tapping on different columns in the bar graph, you can select a different months and see the transactions that make up the spending in that category for that month.
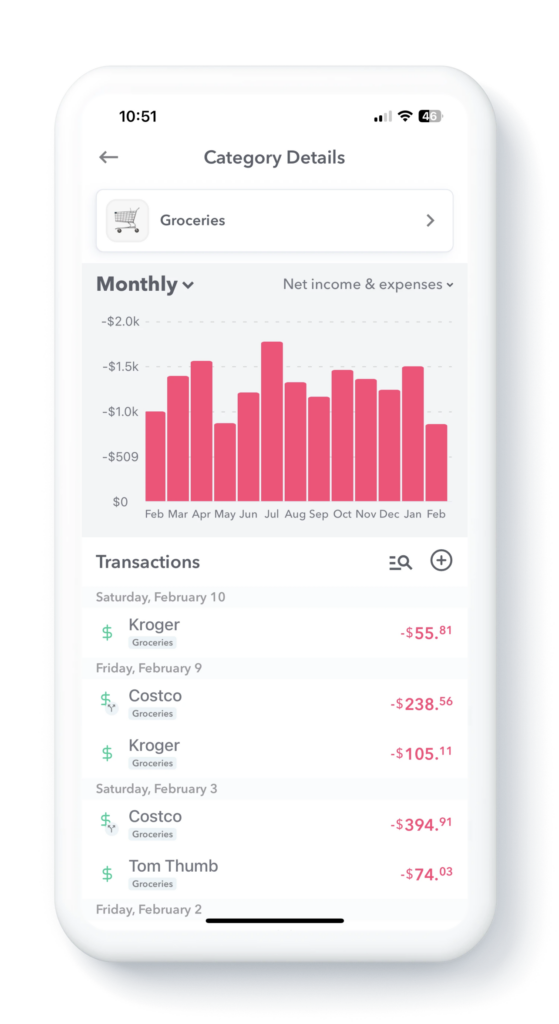
Report views
You can also modify the report to see the data in different ways.
Tapping the top left of the report you can change the interval from “Monthly” to “Yearly”.
Tapping the top right of the report will allow you to adjust what transactions are represented in the bar graph: Income Only, Expenses Only, Income & Expenses or Net Total.
Searching for Specific Transactions
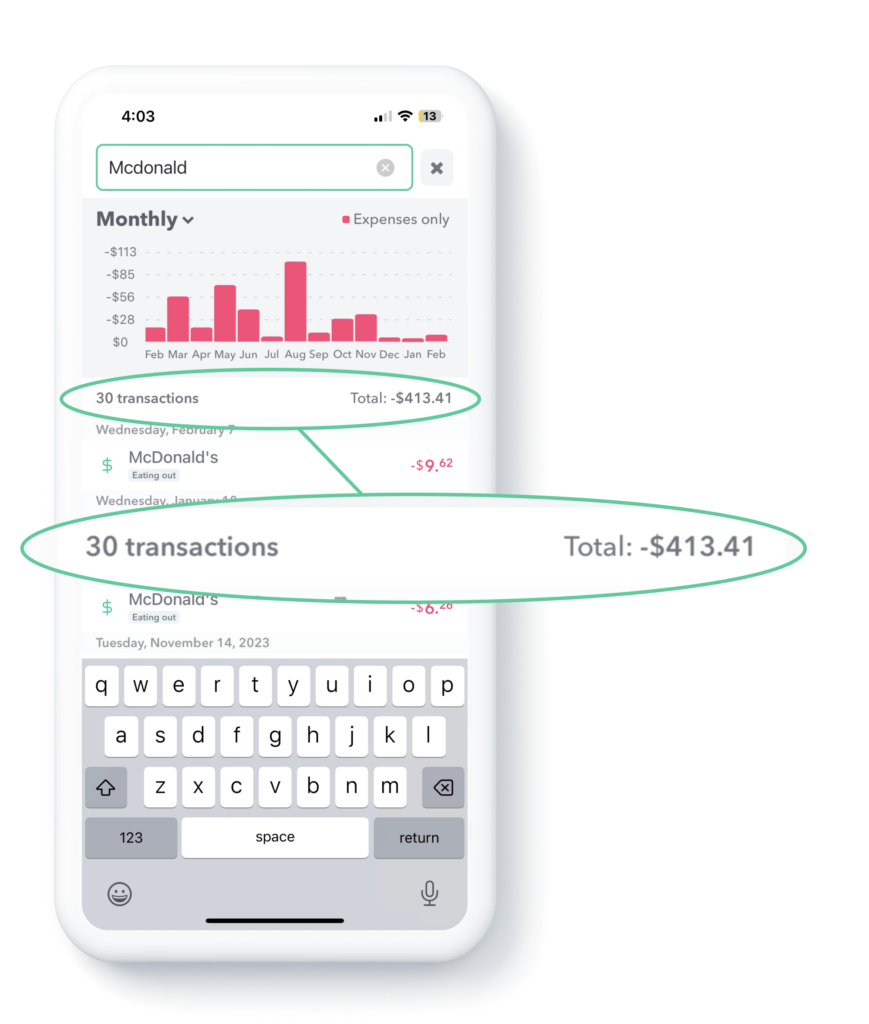
You can also search for specific transactions in the report and the bar graph adjust dynamically. To do this first, swipe down, then type the transactions you are searching for. In the demo below, the user is searching for all the McDonald’s transactions. The bar graph adjusts to show only the McDonald’s transactions and then you can tap different months to see the transactions in those months that are specifically McDonald’s transactions.
Notice also when you enable the search, the report will show the number of transactions that match your search and the total of those transactions.
Upcoming Items Report
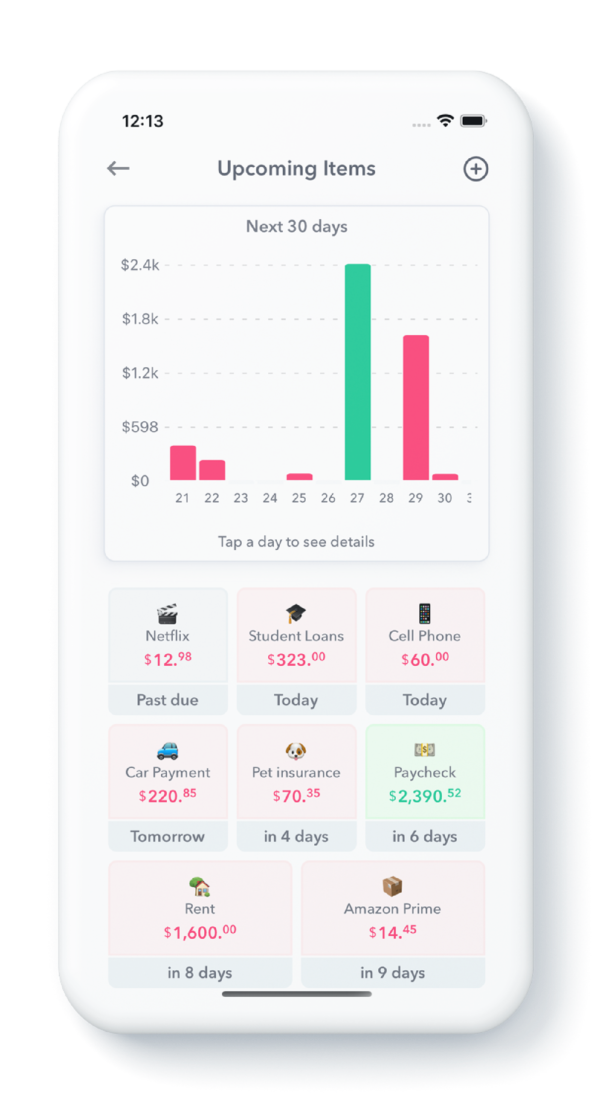
Weekly can set your mind at ease by giving you a view into your upcoming bills and income in the Upcoming Items report. In this report, Weekly shows you the amount of your recurring bills and income as well as the next transaction date in a graph and easy-to-read grid so you can know what is happening in your personal finance world.
You can access this report from the Income & Bills page in the Reports tab, or from tapping the Upcoming Items card on the Dashboard.
Report Sections
The Upcoming Items report shows all bills and income that are going to happen over the next 30 days.
The report is divided into two sections: (1) the bar graph at the top of the page and (2) the actual items that are coming up on the bottom.
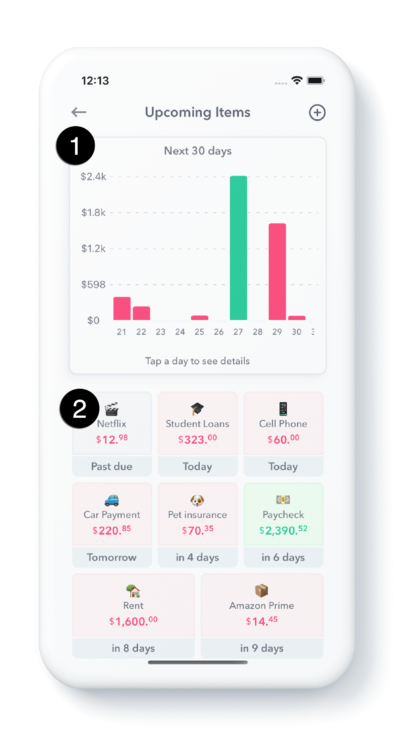
The bar graph at the top shows the total money that is going out or coming in on a particular day. Green means money coming in, red means money going out. The graph goes forward 30 days in time. You can also scroll left and right to see the bar graph earlier and later in time.
Then you can tap any bar and see which items make up the upcoming items. This will turn the bar graph purple and show you the items that make up that amount. So if you have say $42.99 coming out on the 15th, you can tap the $42.99 and see that it may be composed of one $30.01 bill and one $12.98 bill.
Underneath the graph (2), you will see items that are coming up in the next week. It will show the item name, the emoji associated with the item and how many days until the item is happening.

Weekly will tell you how many days until the bill is due. It calculates this number just in the next transaction date. The next transaction date is set in three ways. First if you have mapped a transaction to a recurring expense or income item, Weekly will estimate the next transaction date. So if you have a monthly rent payment of $1,400 and you map an incoming transaction for that $1,400 on say March 6th, Weekly will set the next transaction date at April 6th. Second, you can set the transaction date when you first create the item. Third, you can edit an item and set the next transaction date.
Pro tip – you can tap and hold any of the items in this report to get a quick actions sheet. Here’s an example,
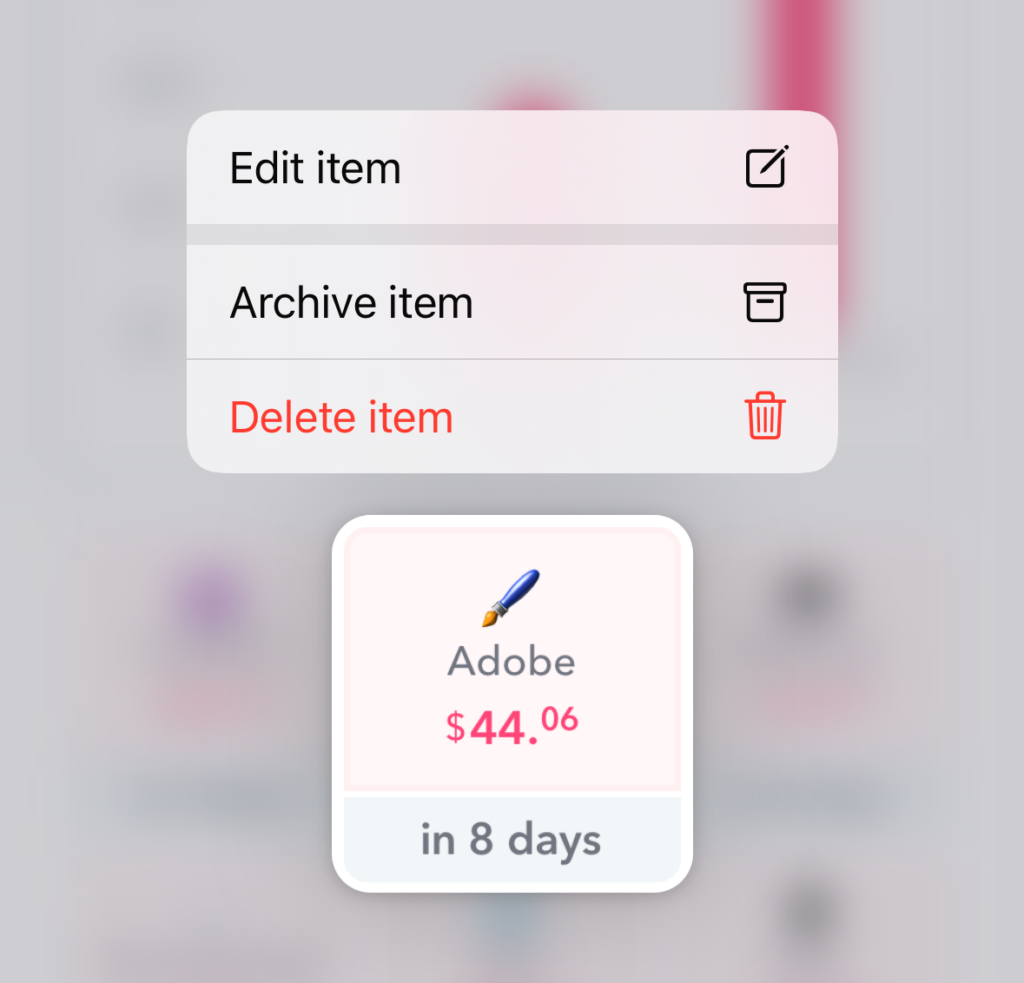
Some of these items may be labeled “Past due”. What this means is that Weekly expects that a bill has already happened, but no transaction has been downloaded into Weekly to match it.
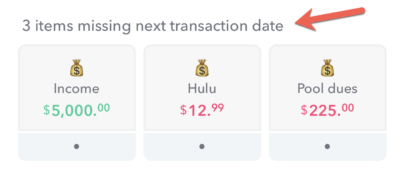
Finally at the bottom of the page you will see items that are missing a next transaction. These are any income or bills that were not given a next transaction date when added to Weekly or have not had a recurring transaction mapped to them.
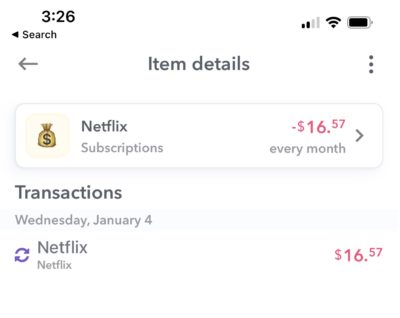
The final thing to know about the Upcoming Items report is that this is also a handy way to see all the income or expenses that have been assigned to that item. So if you have an item for Netflix, you can hit “Netflix” and see all the charges that have been made to Netflix.
Conclusion
Instead of logging into different vendor accounts to figure out what bills are due and when they are due, Weekly gives you an easy way to see all your bills that are upcoming. This can help you be at peace with your personal finances at at a glance know what is happening next in your financial world.
Recurring Budget Item History Report
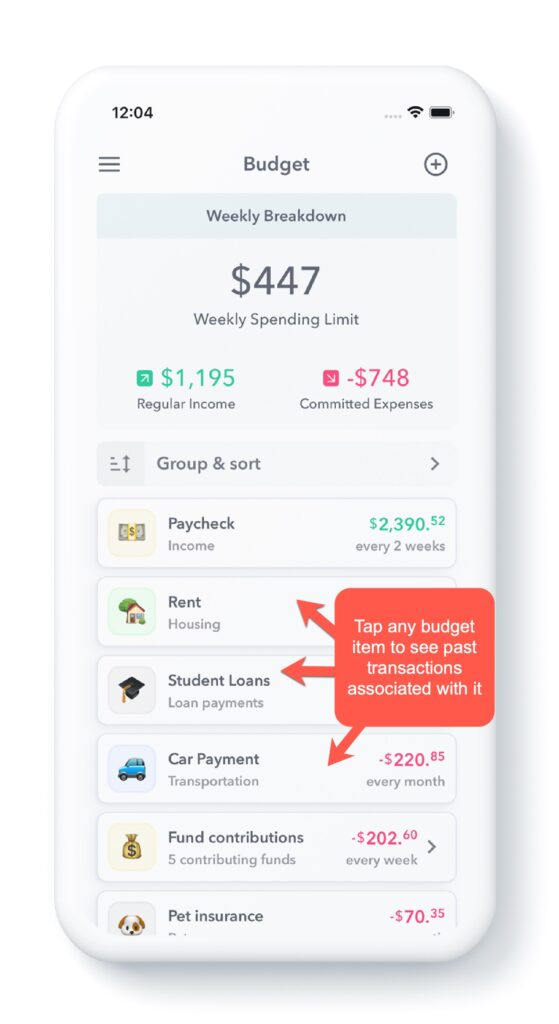
You can see a history of transactions associated with your recurring budget items. So you can see what you have paid for a specific recurring expense over the course of time. Here’s a screenshot of transactions associated with Water bill.
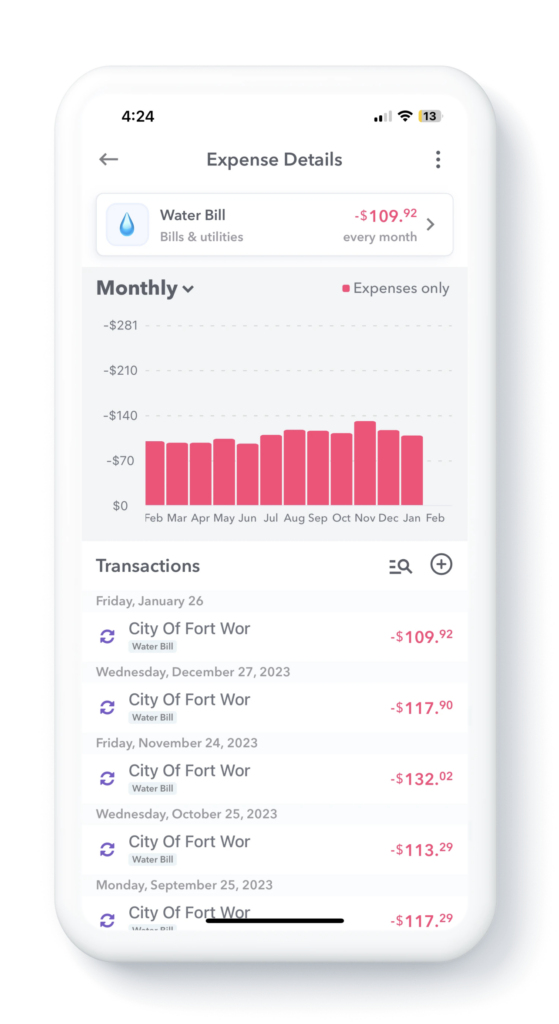
To find this report, go to your budget then tap on the budget item you want to see a transaction history for. You can tap on income or expense budget items.